Berlioz Monitoring
Full-Stack Observability Solution for Microservices
Complete real-time observability platform combining automatic Python error capture, structured storage, WebSocket broadcasting, AI analysis with Claude (Bedrock), and Next.js 15 dashboard for microservices diagnosis and analysis.
Berlioz Monitoring is a full-stack observability solution developed to track, diagnose, and analyze Python microservices errors in real-time. It combines backend instrumentation, PostgreSQL persistence, real-time streaming via WebSocket, and intelligent AI analysis to contextualize and quickly resolve issues.
Core Features
Real-Time Monitoring
Live stream of microservices errors with instant updates via WebSocket. Global paginated view of all logs with sorting and filtering by date, type, status, microservice, and severity.
Analytics & Metrics
System health indicators: total error count, top affected microservices, top exception types, HTTP code distribution, temporal trends with automatic statistical anomaly detection.
Integrated AI Analysis
Automatic AI analysis generation via Claude (Bedrock) with real-time SSE streaming. Error classification (Python type, functional category, severity level) and root cause analysis (RCA) based on stack trace and local variables.
Advanced Debugging
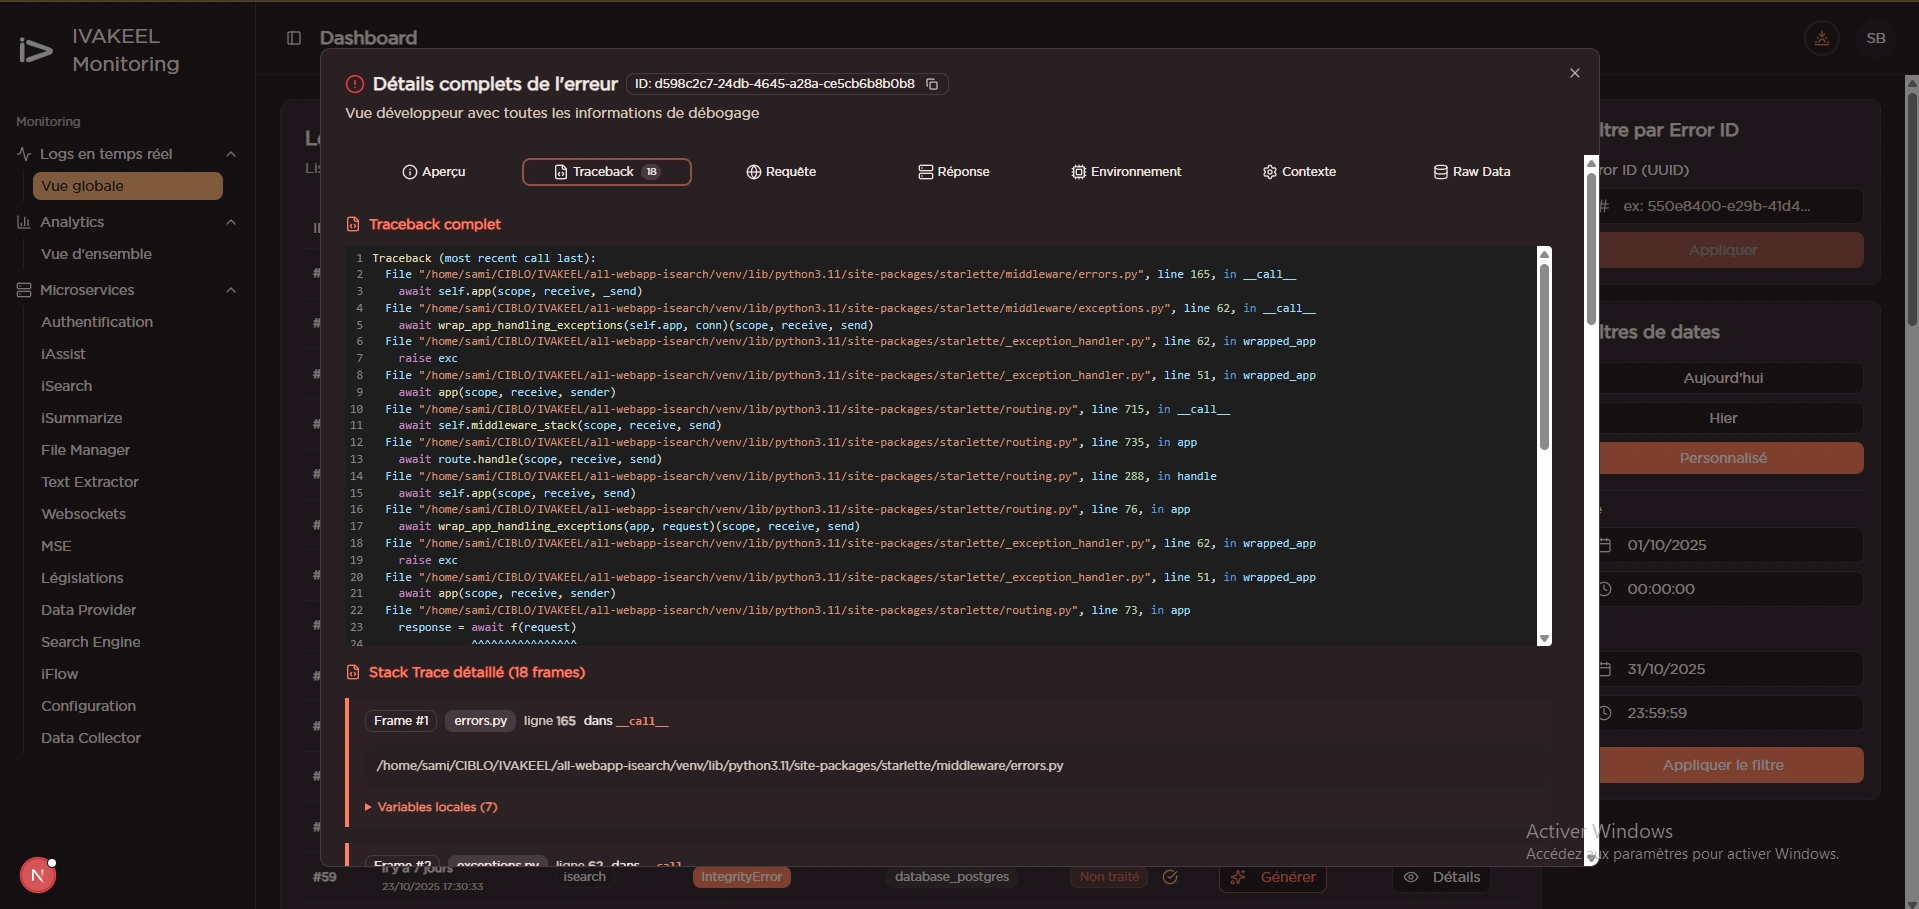
Complete visualization of Python stack traces (up to 18 frames), local variable inspection, environment context (middleware, scope, sender), and automatic error categorization (IntegrityError, ImportError, etc.).
Filtering & Search
Advanced filtering system by date, microservice, error type, status (resolved/unresolved), severity. Text search in logs and stack traces to quickly locate specific issues.
Microservices Management
Complete list of microservices (iSearch, iAssist, iSummarize, File Manager, etc.) with independent analysis: error rates, average severity, frequency, trends per service.
Notifications & Alerts
Automatic alert system via Email and Slack for critical events. Statistical anomaly detection (e.g., +900% errors) with real-time notifications for immediate triage.
Visual Themes
Dark/light mode support with dynamic adaptation of chart colors and contrasts. Professional dark theme (amber/orange palette) and clean light theme for optimal visual experience.
Interface Showcase

View

View

View

View

View
Technical Architecture
Detailed Modules
📋Log Management
Unified ingestion via Celery/Redis with structured payloads and error UUIDs. Persistent logs API with pagination, text search, and advanced filters. Detailed view with complete stack trace and local variables.
📊Admin Dashboard
Centralized dashboard with global log view, interactive analytics charts (histograms, pie charts, bar charts), trend indicators, and real-time system health metrics.
🔧Microservices View
Independent analysis per microservice: error rates, exception type distribution, temporal evolution, identification of most critical services for intervention prioritization.
🧠AI Insights
Automatic AI analysis generation with SSE streaming directly in modal. Executive summary, categorization (database, HTTP, validation, test), severity level (low, moderate, critical), and recommendations.
👥Support Agent Interface
Merges console logs, screenshots, and backend logs for complete diagnosis. User guidance or automatic ticket creation on severe errors for optimized support workflow.
🔔Notifications System
Configurable Email and Slack alerts for critical events. Automatic statistical anomaly detection with customizable thresholds. Real-time notifications for immediate triage.
Strategic Objectives
Quickly detect and diagnose Python microservices errors via real-time observability and automatic analysis
Contextualize errors through AI to understand root cause and accelerate resolution
Provide centralized view of system health with advanced analytics and anomaly detection
Facilitate error triage and prioritization through intelligent classification and proactive notifications
Scale observability for complex microservices ecosystems with high-performance distributed architecture